
Click any of the tabs or subtabs above to view the main help page for your selection.
Considerations
The Portfolio Analytics tool enables you to view long portfolio positions by asset allocation, industry diversification, market capitalization and top ten holdings. Further, the tool offers a historical view the provides trend analysis on your diversification mix over the last five month ends.
Click any of the links below for additional information on the sections on the Analytics page.
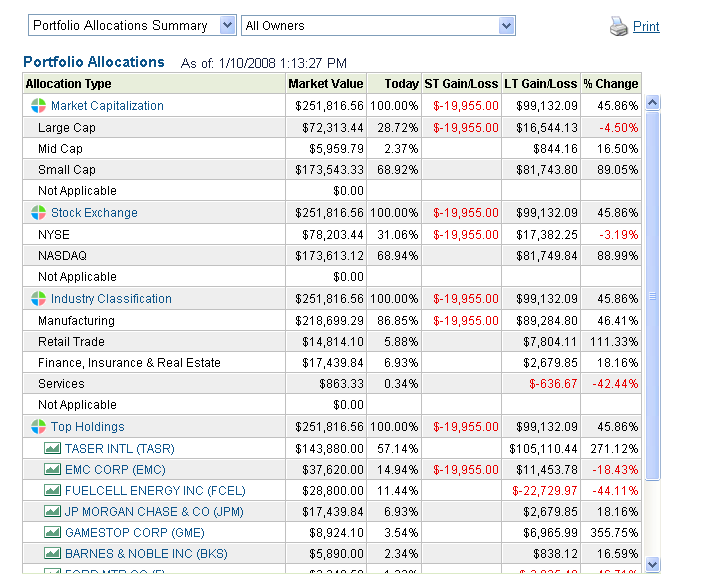
To help you with your diversification needs, GainsAdvisor calculates portfolio allocation based on Market Capitalization Mix, Stock Exchange, Industry Classification, or Top Holdings. Cumulative market values, short and long-term gains and losses, and stock appreciation (depreciation) are provided for each asset category.
Market Capitalization represents the size of the securities you are invested in. Market Capitalization is calculated by multiplying shares outstanding by the current market price.
Large Cap - Securities with a market capitalization greater than $5,000 million.
Mid Cap - Securities with a market capitalization between $1,000 million and $5,000 million.
Small Cap - Securities with a market capitalization between $100 million and $1,000 million.
Micro Cap - Securities with a market capitalization less than $100 million.
NYSE: The New York Stock Exchange
NASDAQ: The North America Securities Dealers Association
AMEX: The American Stock Exchange
OTC: The Over-the-Counter Exchanges
GainsKeeper uses SIC industry classification codes to categorize your holdings.
Your top ten holdings are provided with percentages of total portfolio.
Select the Magnifying Glass to view specific holdings for each market category type.
Click the Print button to print the analytics page.
Example
Click here to view an example of the Analytics page.
Put the mouse pointer over any of the fields below for additional information. You can also click the fields to access additional information on that section.
![]()